Beauhurst · 2023
Invoice financiers and lenders needed charge and mortgage data, the legal claims against a company's assets, to judge risk. The only real source was clunky and lived outside Beauhurst. I designed it into the platform. Subscription orders rose 20% and the feature drew over 3,600 views in three months, against a predicted 1,000.
Role
Product Designer
Platform
Web
Team
One designer (me), engineering team, data lead
Tools
Figma, Condens, Zoom

20%
subscription increase
3,600+
views in 3 months
3.6×
predicted traffic
Overview
Beauhurst kept getting client requests to add charge and mortgage data, the legal claims a company gives against its assets when it takes on secured debt. Invoice financiers and lenders use it to judge risk for due diligence, but the only real source was Companies House. I was tasked with bringing this dense legal dataset into the platform and making it readable for people who understand it commercially, not legally.
The problem
Analysts, invoice financiers and lenders needed to check charges and mortgages to judge risk against a company's assets. The only real source was Companies House, which was non interactive and cumbersome, so people worked across separate tools instead of inside Beauhurst. The hard part was making dense legal data readable for someone who understands what it means commercially, not legally.
Goals
- 01Make charge and mortgage data searchable, so users can find companies that hold secured debt.
- 02Help people read a company's debt history and risk at a glance, without opening legal documents.
- 03Build it as a system that later datasets could slot into.
What the research told me
5
interviews with invoice financiers, refinanciers and lenders, coded in Condens. Historical timelines, not single data points, were what actually drove a lending decision.
People disagreed on whether a charge is even a transaction, and the words charges versus mortgages caused real confusion. Language was a design problem, not just a labelling one.
Key decisions
Learned how risk people actually think
I ran remote interviews with five customers, invoice financiers, refinanciers and lenders, and coded them in Condens. Two things stood out. People disagreed on whether a charge is even a transaction, and the words themselves, charges versus mortgages, caused real confusion. Historical timelines kept coming up as the thing that actually drives a lending decision.
Stopped forcing charges into transactions
My first concept tucked charge data inside the existing Transactions tab. Moderated testing with two financier clients and three account managers killed that quickly: people see charges as separate from fundraising events, and mixing them broke their mental model. I gave charges their own dedicated tab, which also made the relationship between charges and mortgages clear.
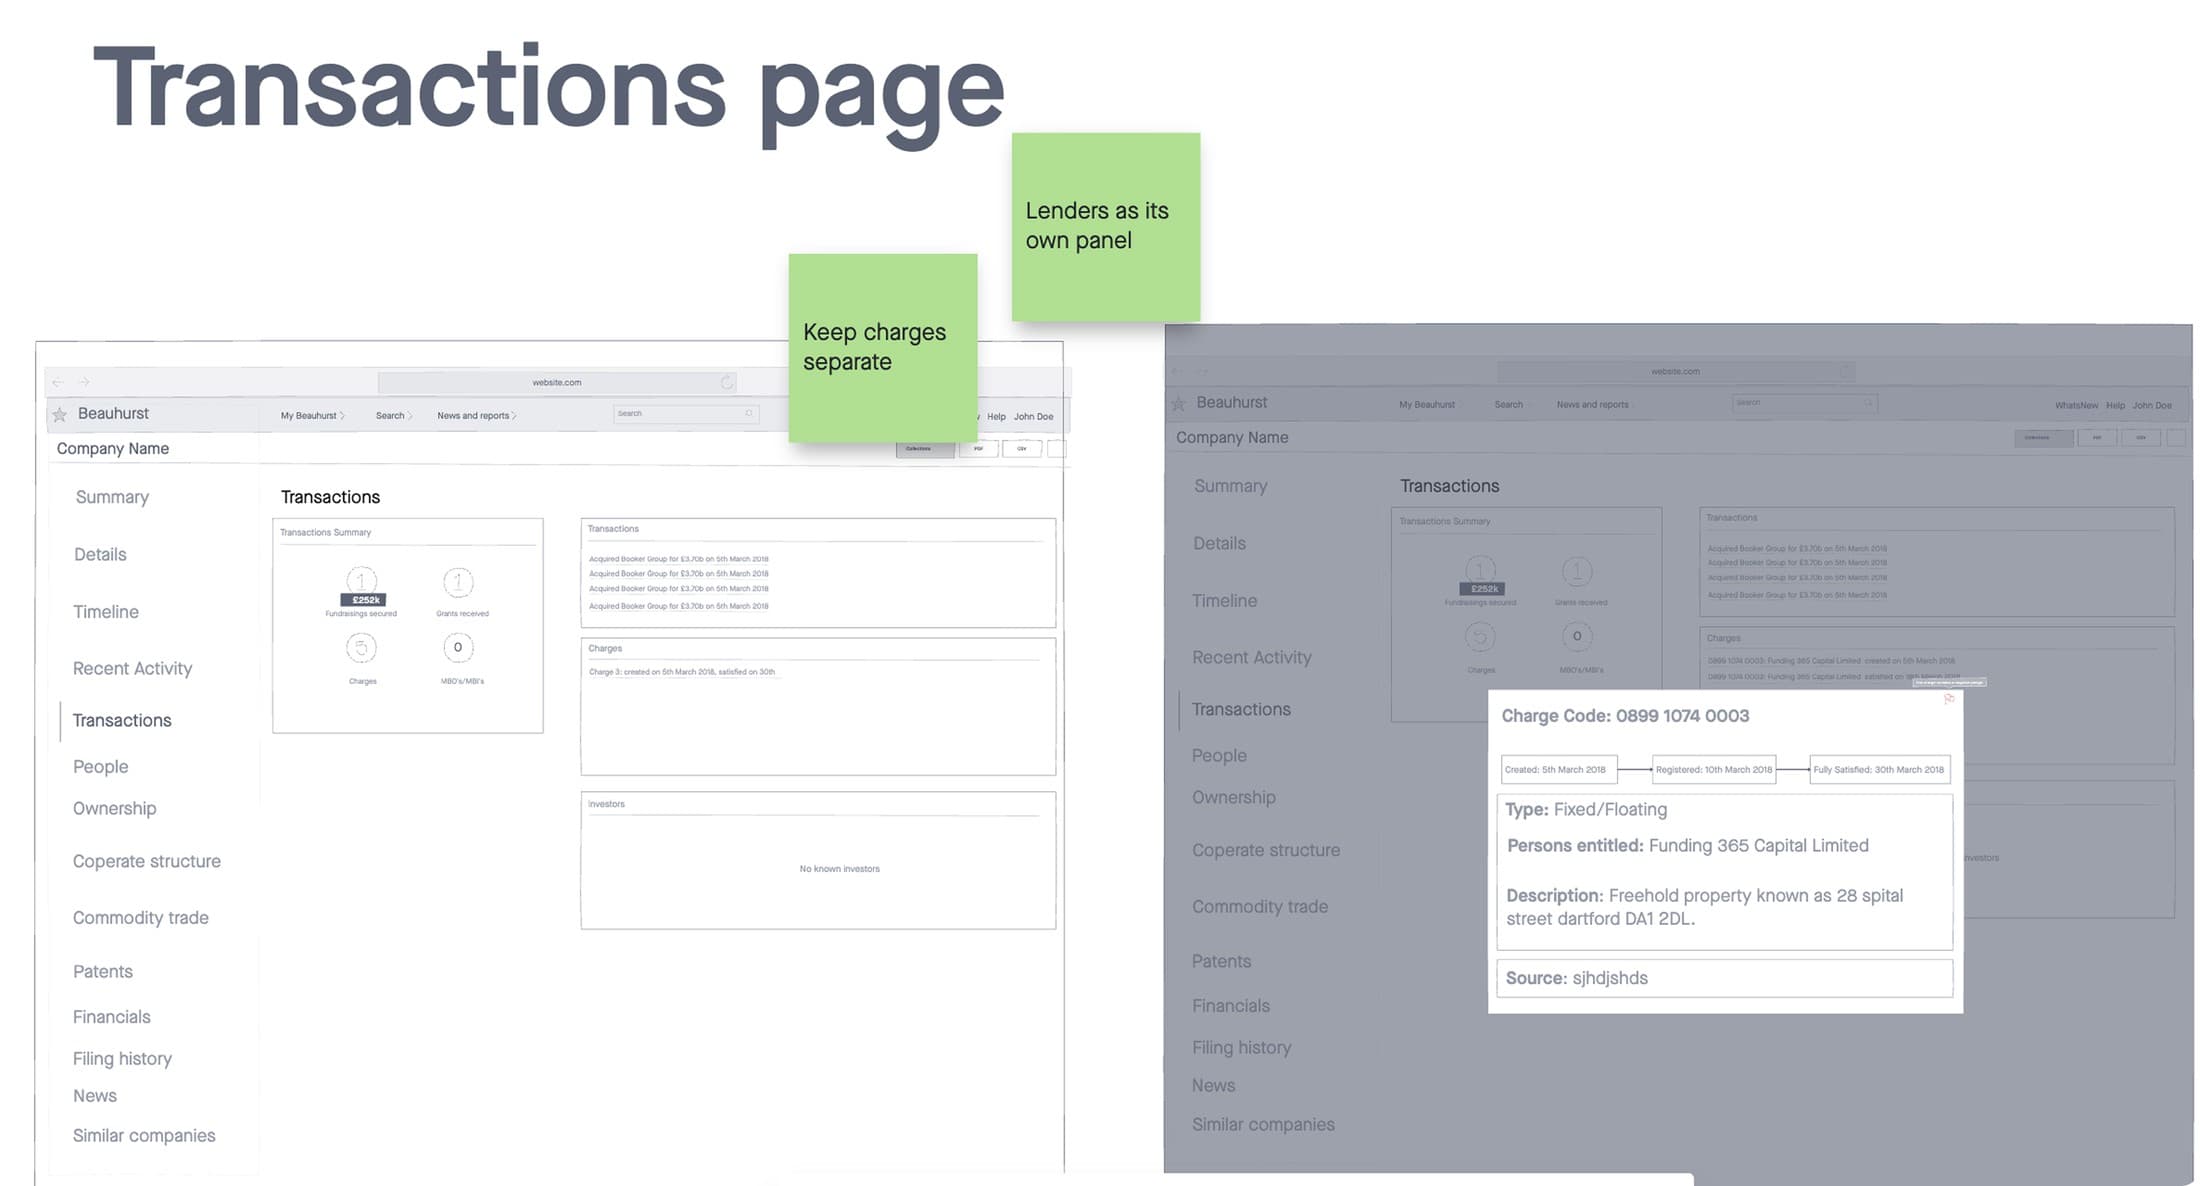
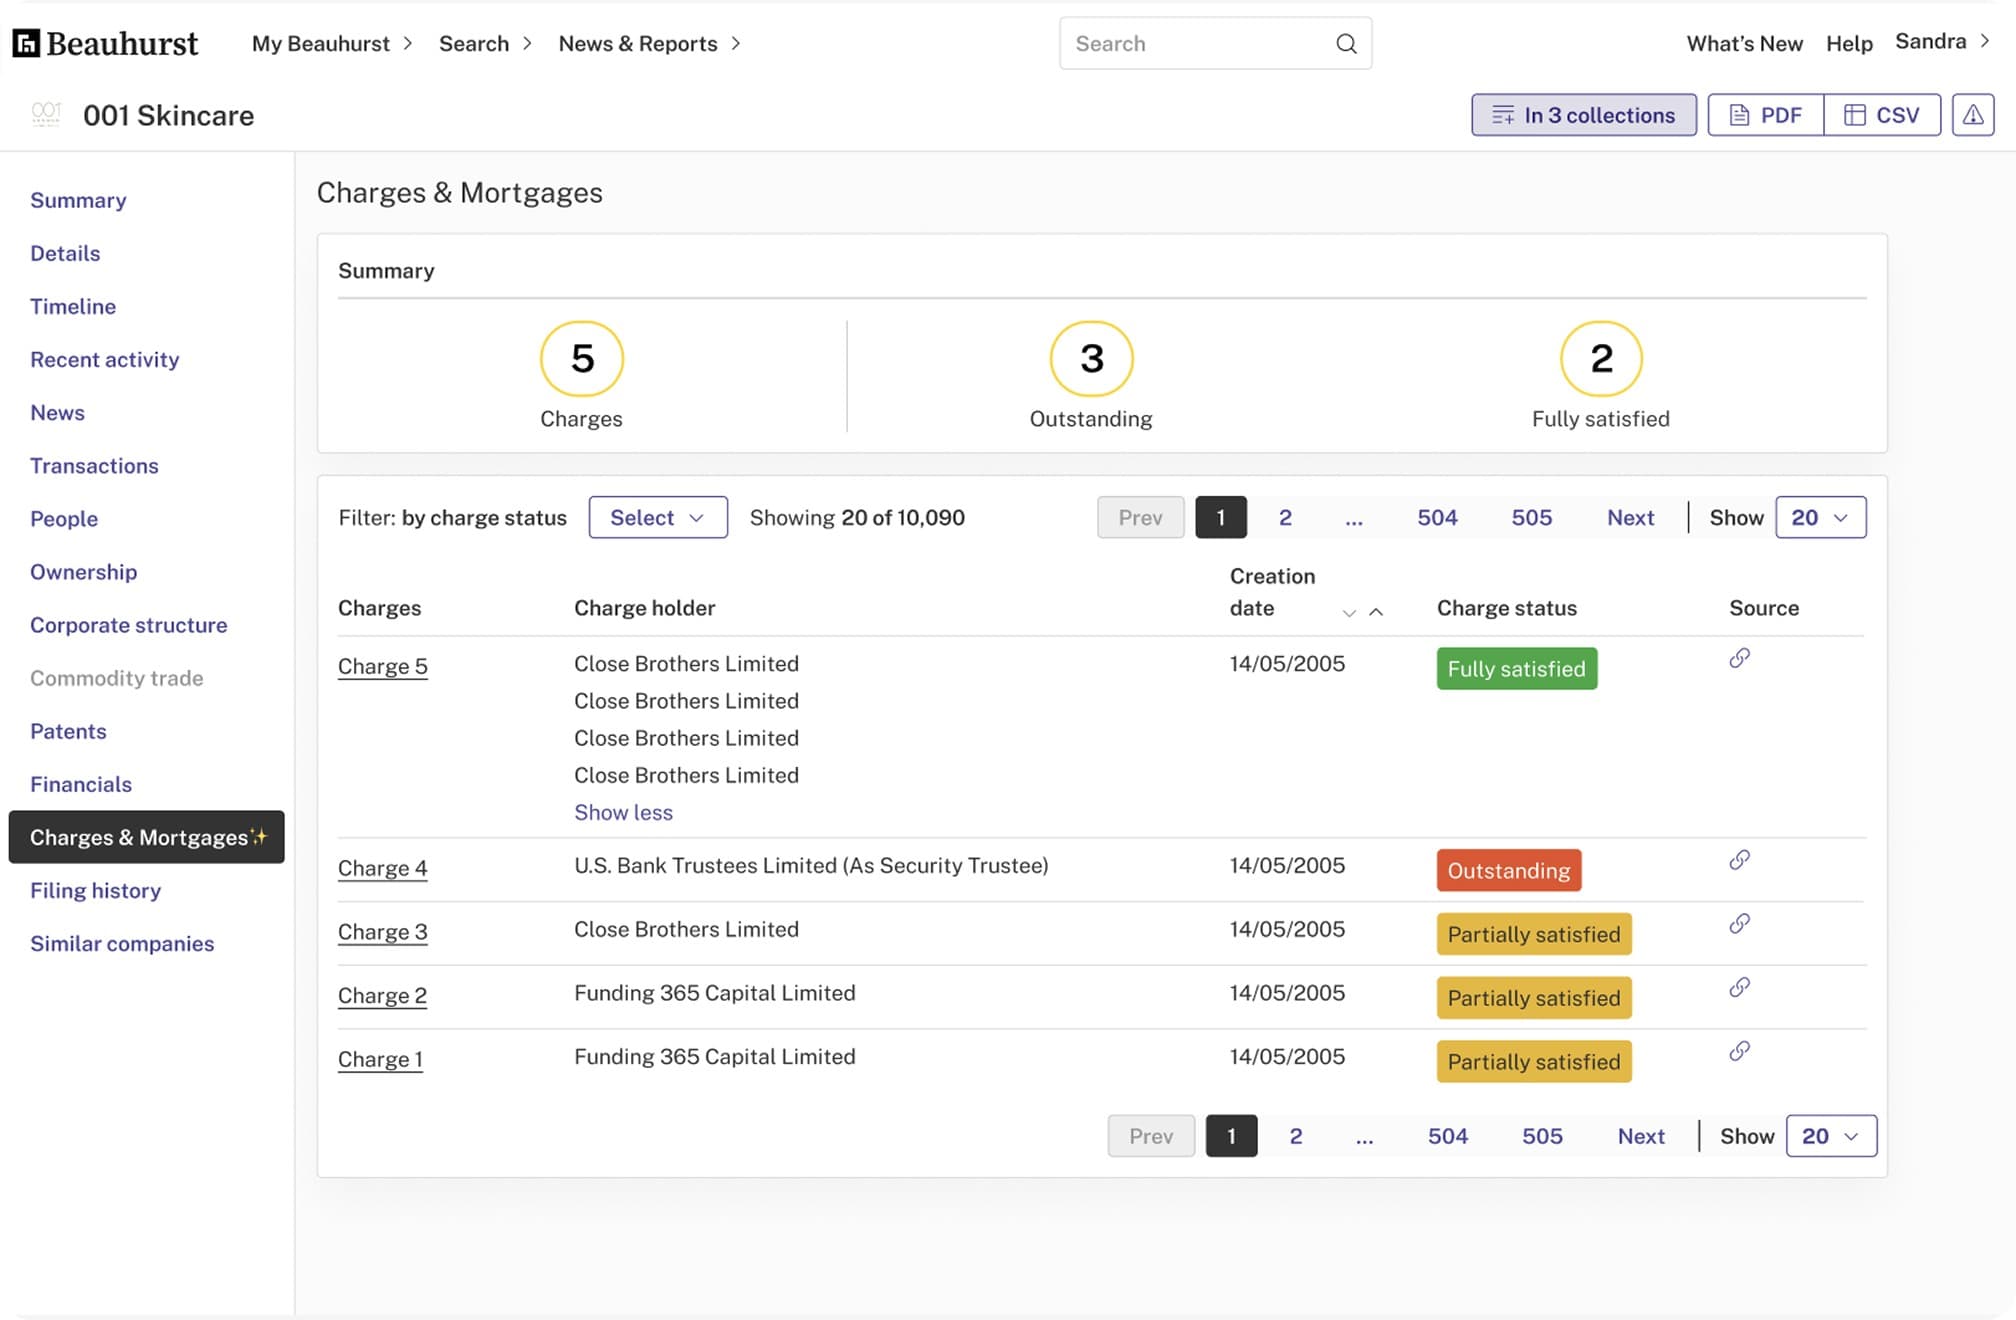
The rejected concept tucked charges inside the Transactions tab. Testing killed it, so I gave charges their own dedicated tab, which also made the charges and mortgages relationship clear.
Made status and history legible
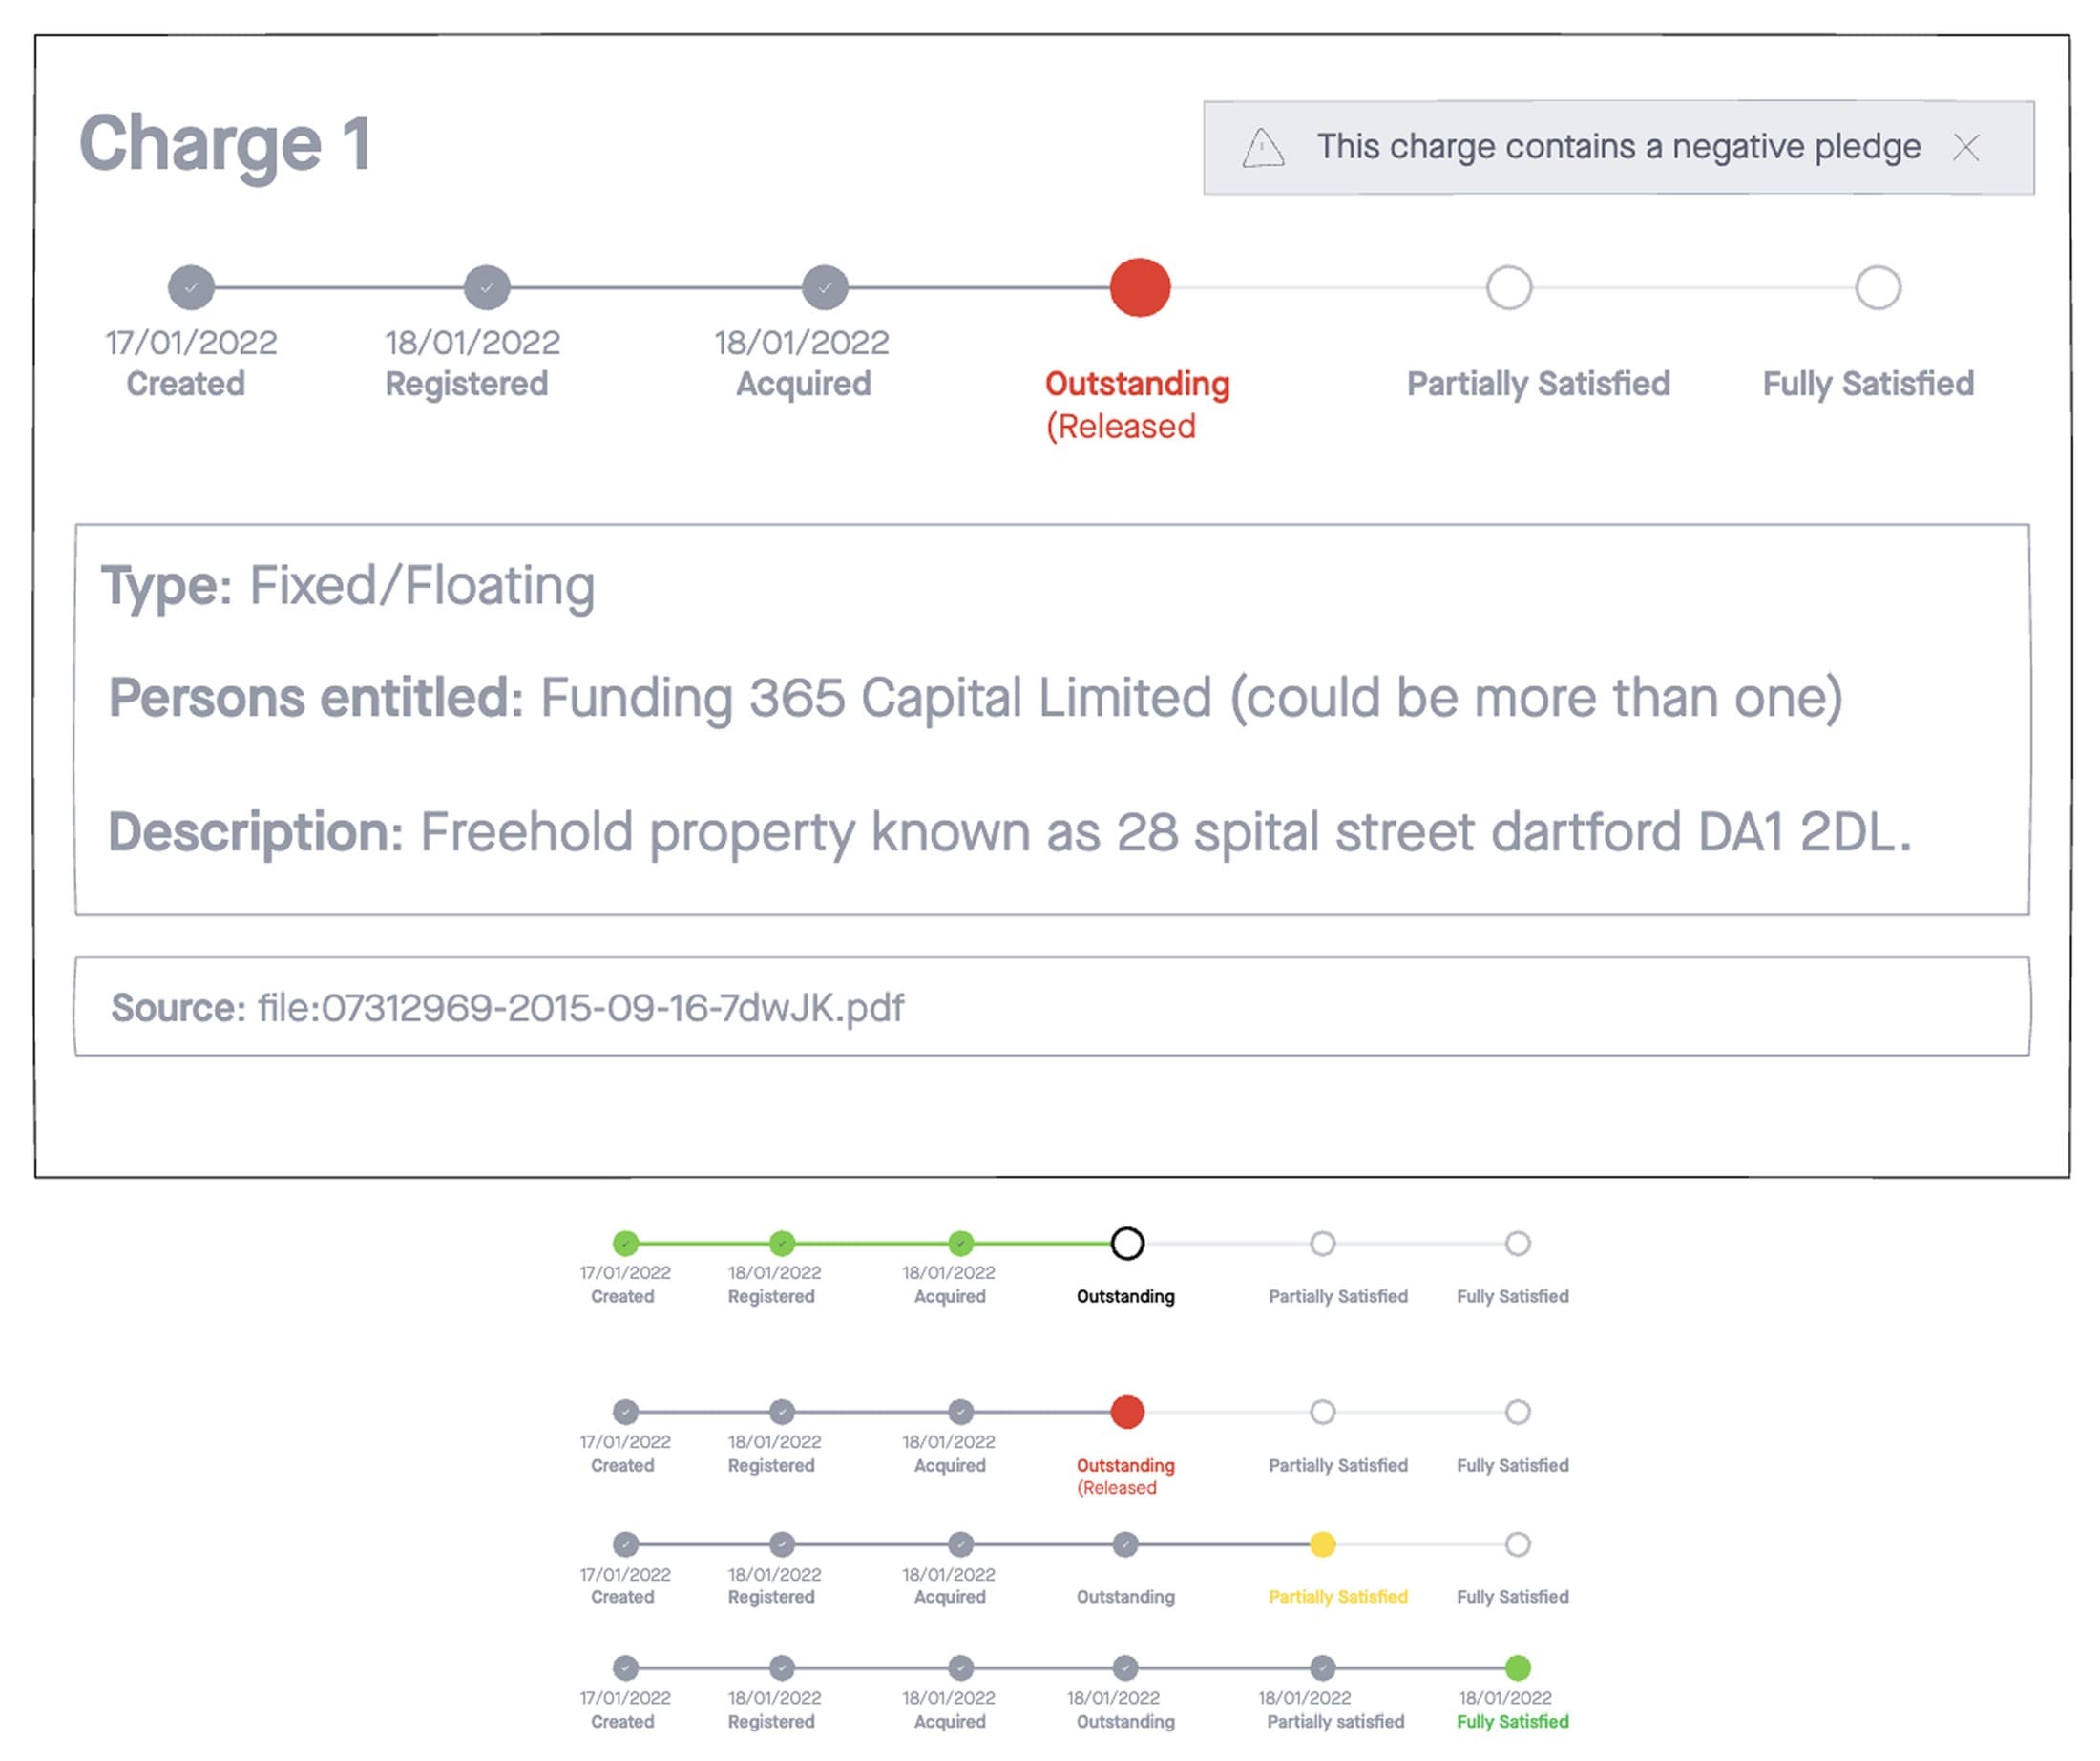
A traffic light system shows charge satisfaction at a glance, so you can read risk without opening anything. Detail sits behind modals, using progressive disclosure to avoid overload. For history I redesigned the timeline around a transit map style, which gave people the temporal context to assess risk without reading the underlying legal documents.
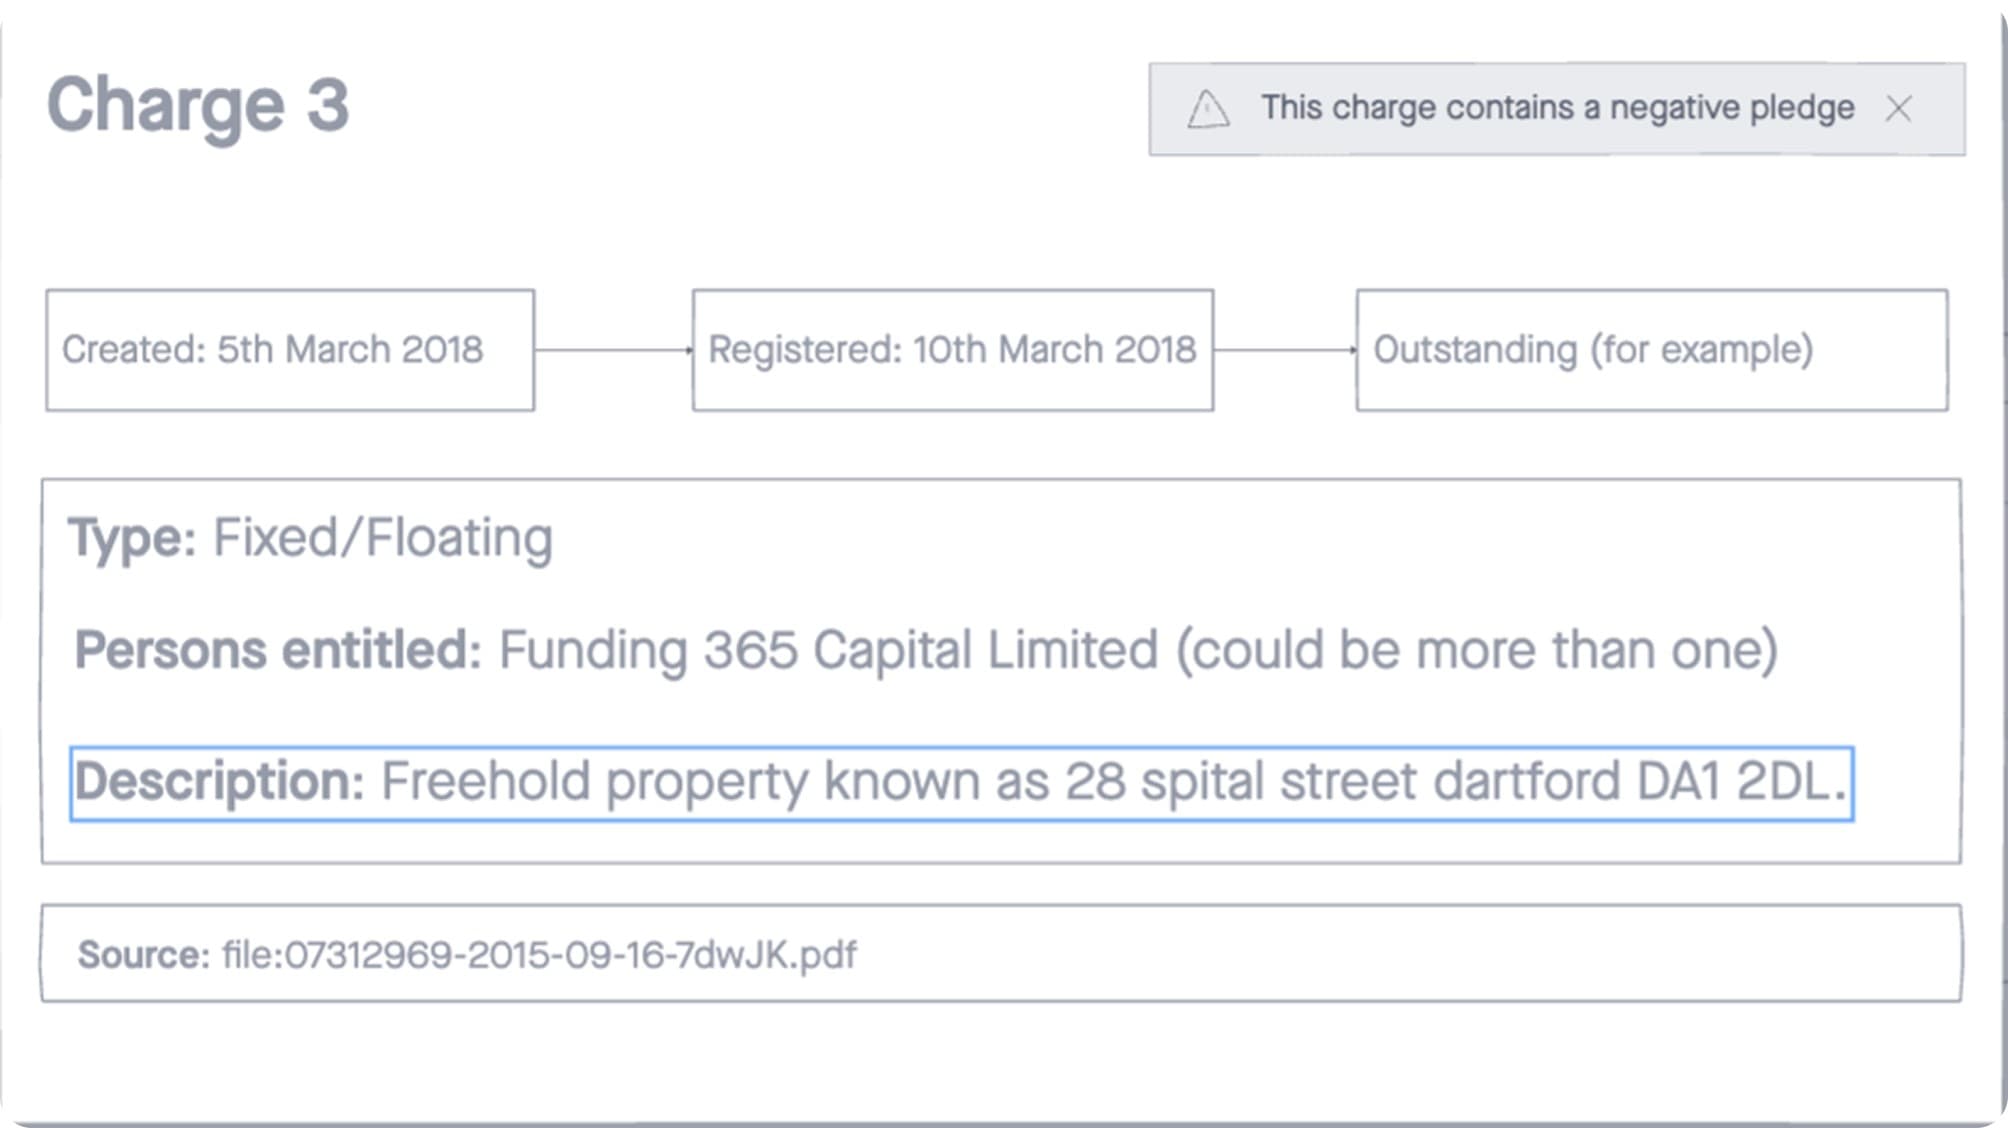
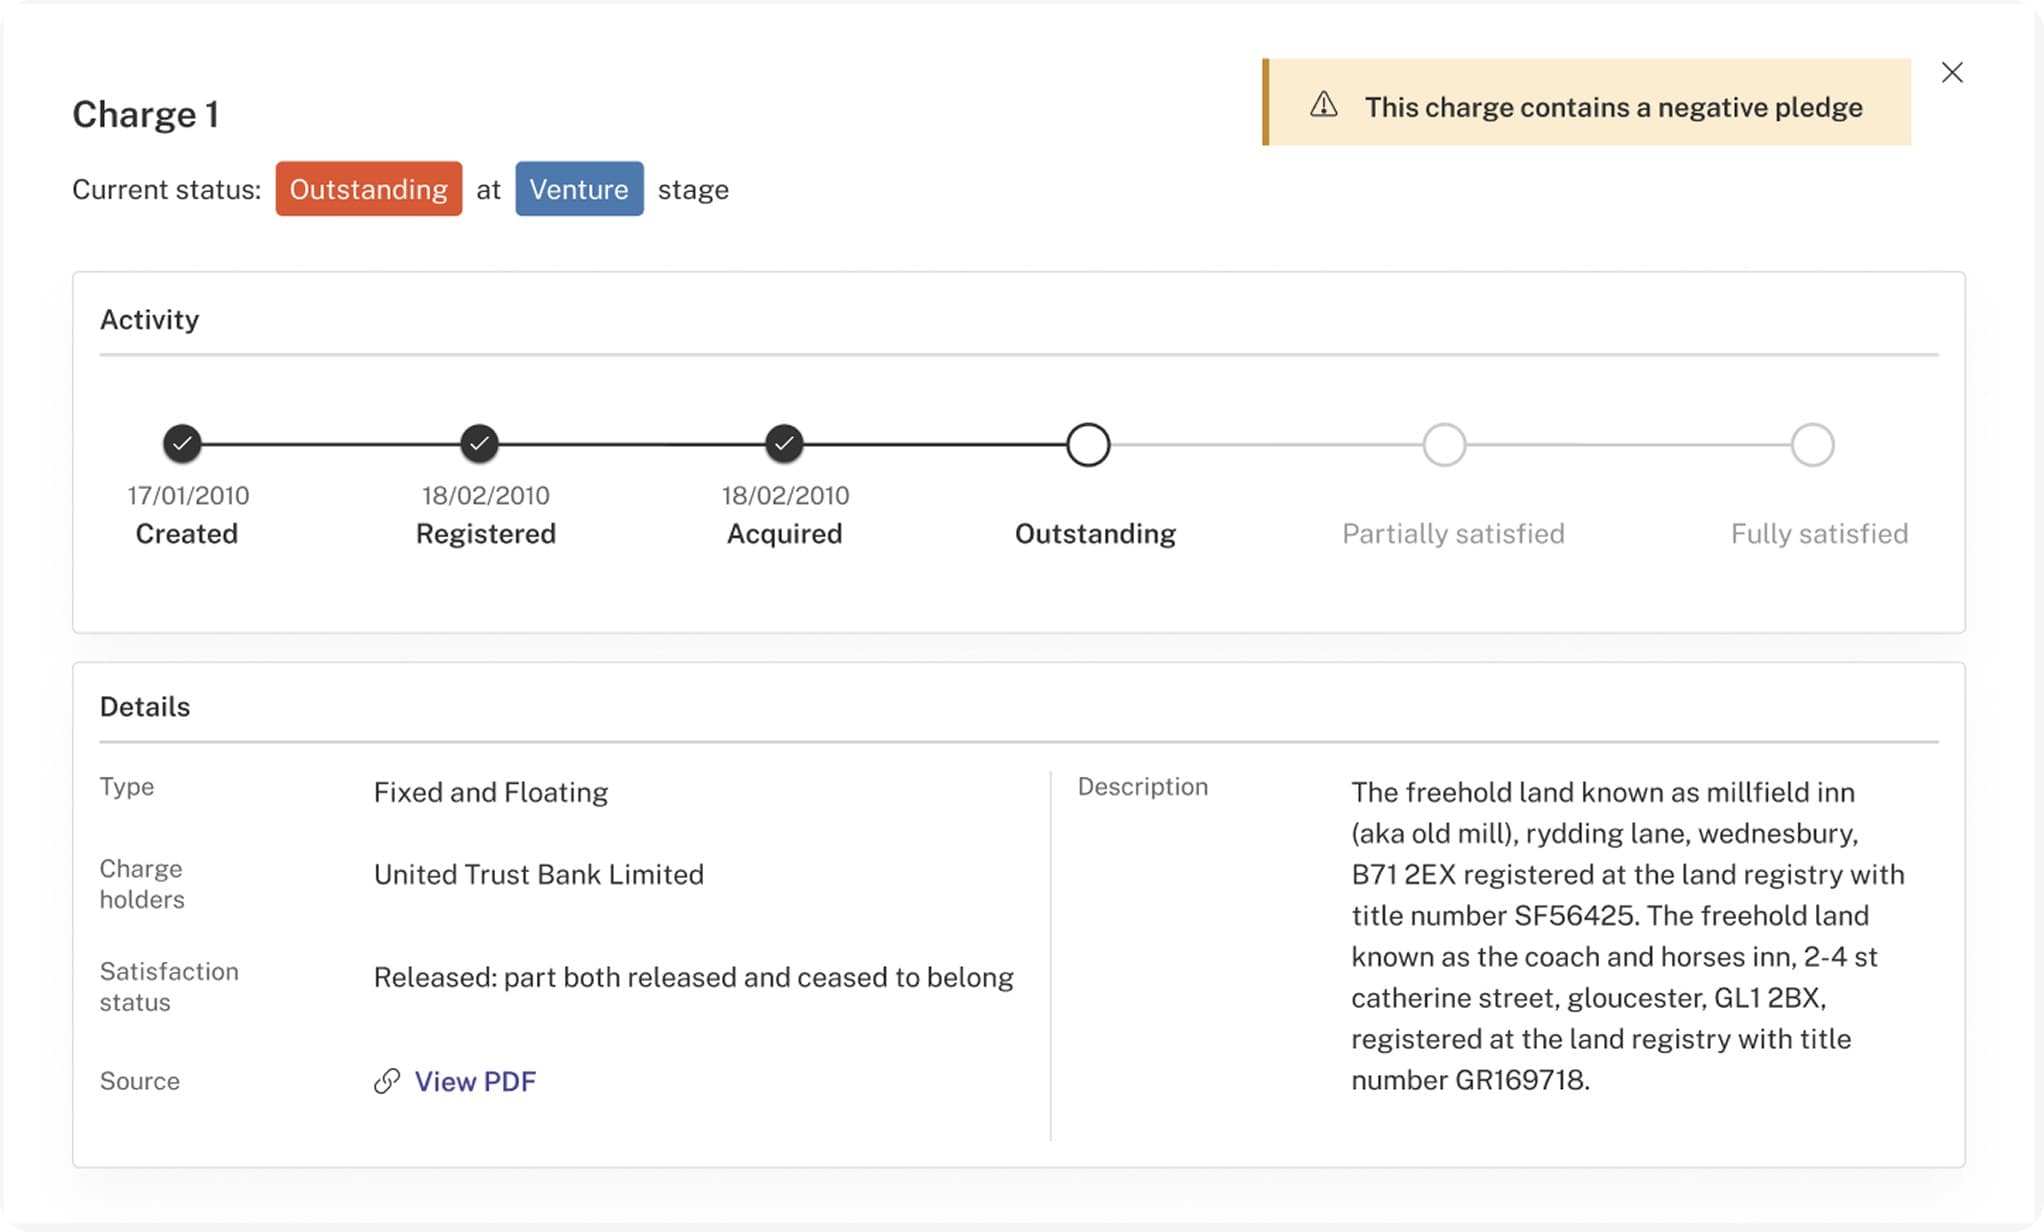
The charge detail, early version versus the redesign: colour-coded status you can read at a glance, and a transit-map style timeline of the charge's history, with the rest behind progressive disclosure.
Built it to take the next dataset
I worked within third party data limits and regulatory definitions, and handed structured specs to engineering. I built it as a system, so later data types could slot into the same search, tab and disclosure patterns rather than being designed from scratch.
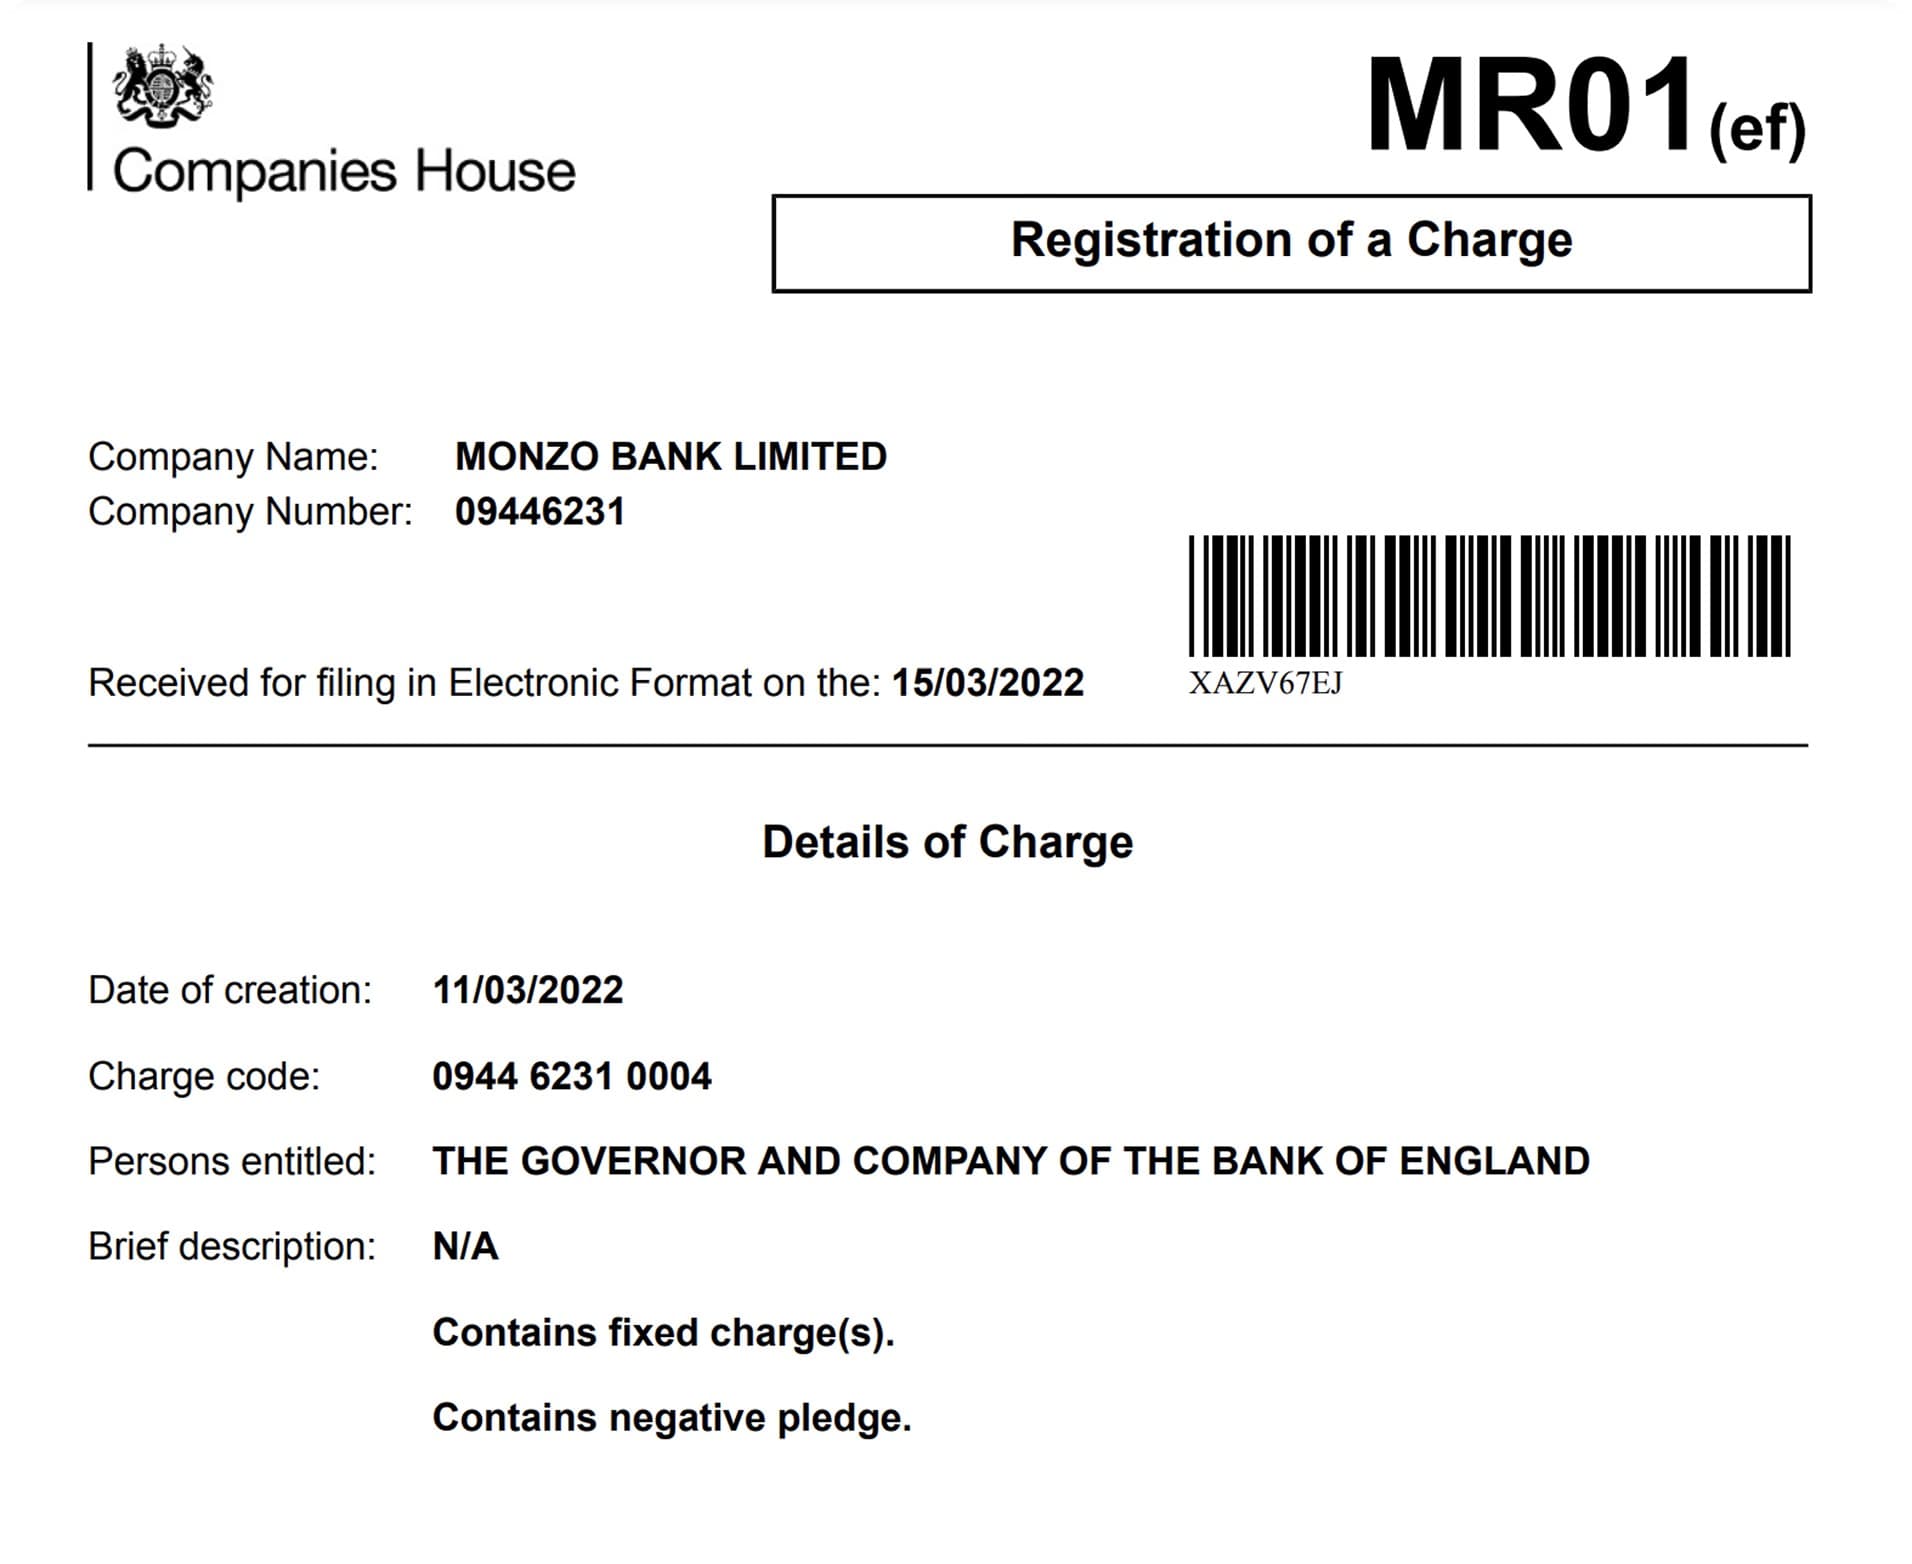
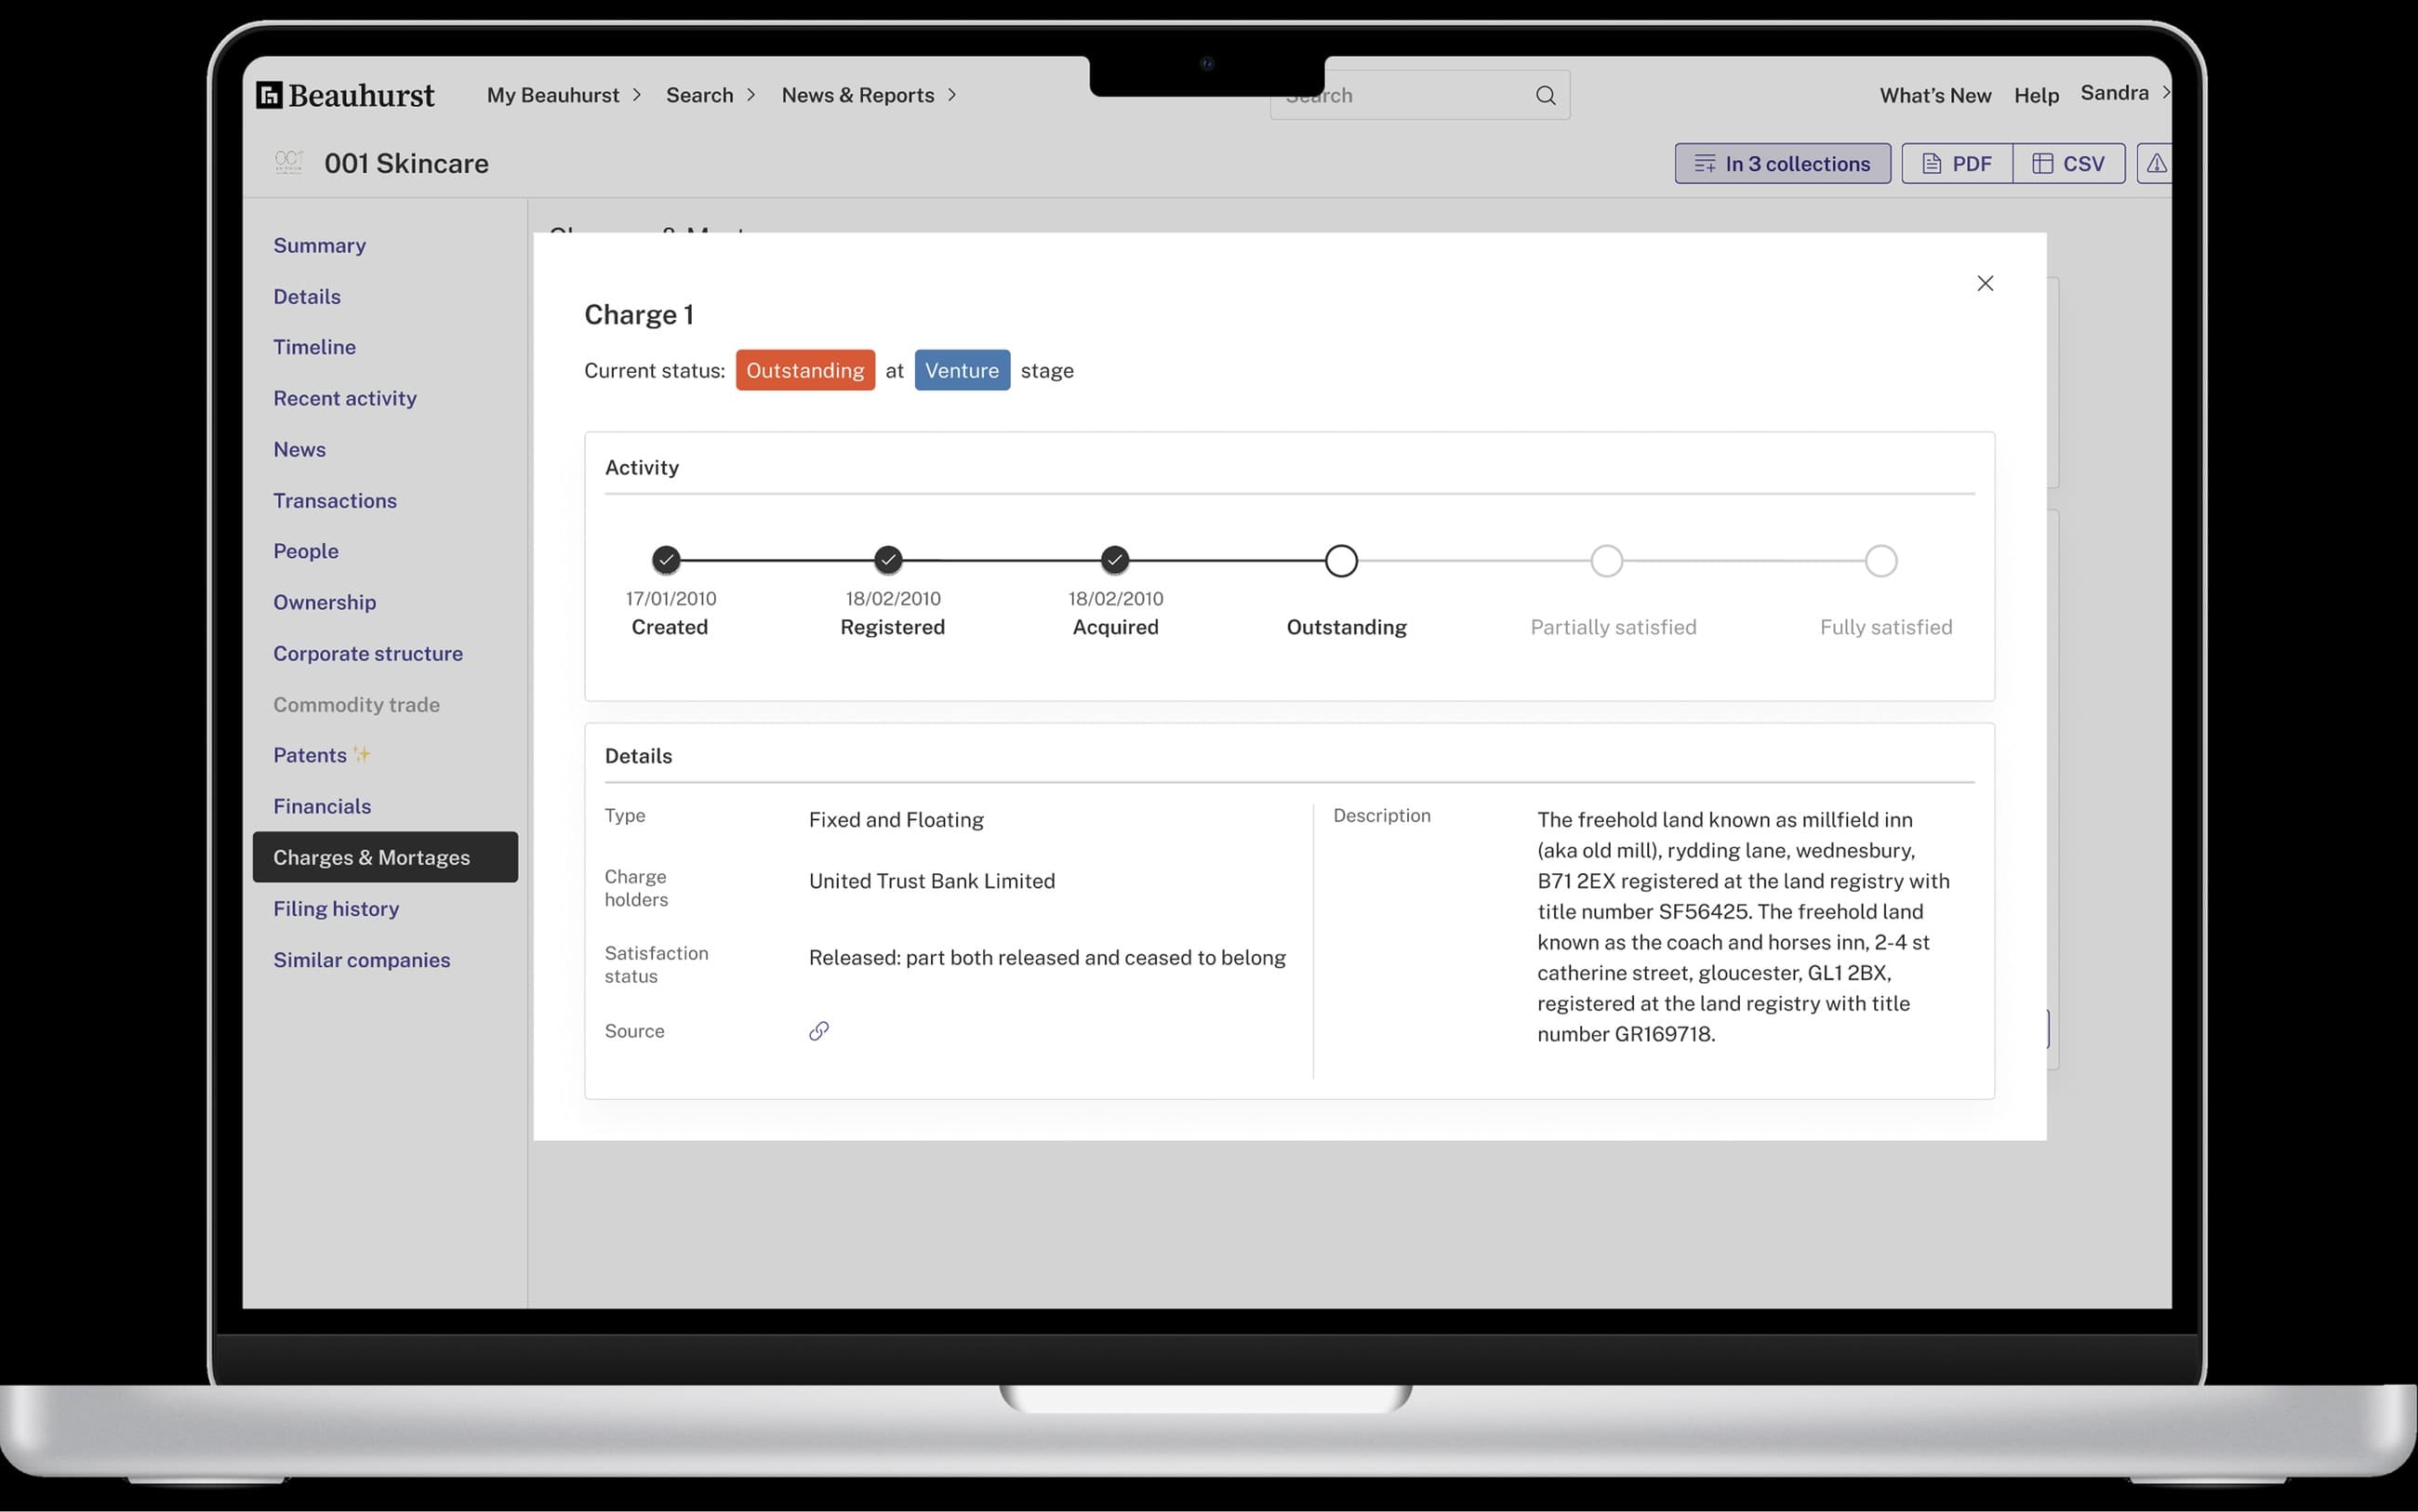
The raw source people had to work from on Companies House, versus the readable charge view I designed inside Beauhurst, built on search, tab and disclosure patterns that later datasets could reuse.
The outcome
Subscription orders rose 20%, and the feature drew over 3,600 unique views in three months against a predicted 1,000. The dedicated tab, advanced search and modal system shipped, and the patterns carried into later data features on the platform.
What I would do differently
With complex data, the hard part is making the meaning clear without dumbing down the structure. People's mental models of debt and risk turned out to matter more than the underlying schema, and designing to how they actually think is what made the legal detail usable.